The Elastic Stack also known as the ELK stack consists of Elastic Search, Kibana, Beats and Logstash. These products when put together allows you to ingest data that is structured or unstructured, explore and analyse those data and visualize it in real time. This article guides you through the installation and basic configuration of ELK stack on an Ubuntu machine. The same steps could be applied to any Debian based system.
Installing and Configuring Elastic Search
At the core of the Elastic Stack is the Elastic Search, which can store, search, and analyze data that is of any type, whether it is text, numerical, or geospatial.
Follow these steps to install and configure Elastic Search on a Ubuntu or Debian based system.
Download
Download the Debian package for the latest version of Elasticsearch.
curl -L -O https://artifacts.elastic.co/downloads/elasticsearch/elasticsearch-7.4.0-amd64.debVisit the Elasticsearch downloads page to check the latest version and the download URL for the Deb 64 bit package.
Install
Run the following command to install the Debian package that you've downloaded.
sudo dpkg -i elasticsearch-7.4.0-amd64.deb
Run
Configure Elasticsearch service for auto-start.
sudo systemctl enable elasticsearch.service
Start Elasticsearch service.
sudo systemctl start elasticsearch.service
Verify
To verify installation is successful, run
curl http://localhost:9200
which should return something like this:
{
  "name" : "otg-pc",
  "cluster_name" : "elasticsearch",
  "cluster_uuid" : "eC6pyh_3Sku5AFMEKpgjcw",
  "version" : {
    "number" : "7.4.0",
    "build_flavor" : "default",
    "build_type" : "deb",
    "build_hash" : "22e1767283e61a198cb4db791ea66e3f11ab9910",
    "build_date" : "2019-09-27T08:30:45.569419Z",
    "build_snapshot" : false,
    "lucene_version" : "8.2.0",
    "minimum_wire_compatibility_version" : "6.8.0",
    "minimum_index_compatibility_version" : "6.0.0-beta1"
  },
  "tagline" : "You Know, for Search"
}
Key folders and files
| /usr/share/elasticsearch | Elasticsearch Home folder. |
| /etc/elasticsearch/ | Config folder. |
| /var/log/elasticsearch | Log folder. | /var/lib/elasticsearch | td>Default Data folder.
| /etc/elasticsearch/elasticsearch.yml | Config file for node and cluster configuration. |
| Config file for system properties. |
Configuring Elasticsearch
Here are some of the basic settings you may be interested in changing. All of these settings discussed below are in the config file /etc/elasticsearch/elasticsearch.yml. You need to have root privilege to edit this file.
network_host: IP address to bind to. Default is 127.0.0.1 and [::1]. If you want Elastic search service to listen to all IP address on your machine then set this to 0.0.0.0
http.port: HTTP port to bind. Default is 9200.
cluster.name: Name for your Elasticsearch cluster. Default name is
elasticsearch.node.name: Name for the node. Default is the host name.
path.data: Path to the data directory. Default is
/var/lib/elasticsearchpath.logs: Path to the log files directory. Default is
/var/log/elasticsearchdiscovery.seed_hosts: List of other nodes in the cluster that are master-eligible and can be used to seed the discovery process. The defaulis 127.0.0.1, [::1].
cluster.initial_master_nodes: List of nodes whose votes will be used for electing a cluster master initially. You must use the same name that you use in node.name setting.
Installing and configuring Kibana
The job for Kibana in the Elastic stack is to visualize the data. It acts like a front-end for Elasticsearch. Follow these steps to install and configure Kibana on Ubuntu and other Debian-based systems.
Download
Download the Kibana Debian package.
curl -L -O https://artifacts.elastic.co/downloads/kibana/kibana-7.4.0-amd64.debThe download may take few minutes as it is quite big in size. Visit Kibana Downloads page to check the latest version and get the download URL to use the curl command above.
Install
To install Kibana from the debian package, run
sudo dpkg -i kibana-7.4.0-amd64.deb
Run
Configure Kibana to start automatically on boot.
sudo systemctl enable kibana.service
Start Kibana service.
sudo systemctl start kibana.service
Verify
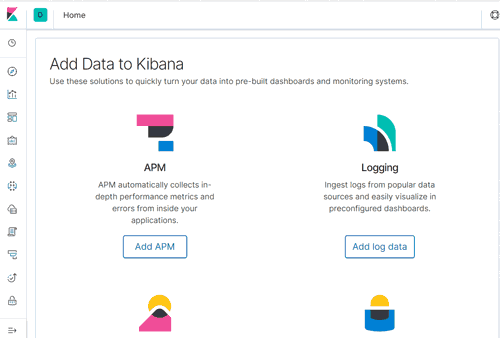
To verify the installation, point your web browser at
which should display the Kibana home page.http://localhost:5601
To display the status page, go to the url
http://localhost:5601/status
Install Logstash (optional)
Logstash allows you to process and ingest the data in to Elasticsearch. You can modify the data whichever way you like before it is pushed to an index in Elasticsearch. Follow these steps to install and configure Logstash on Ubuntu or Debian based system.
Download
Download the Debian package for the latest version of Logstash.
curl -L -O https://artifacts.elastic.co/downloads/logstash/logstash-7.4.1.deb
Install
Before installing Logstash you need to install Java.
sudo apt-get install openjdk-8-jre
sudo dpkg -i logstash-7.4.1.deb
Run
To enable and run Logstash as a service, run the following commands.
sudo systemctl enable logstash.service
sudo systemctl start logstash.service
Verify
To verify the logstash installation we can create and run a basic pipeline. The following command reads string from the standard input, converts to uppercase and display on standart ouput.
cd /usr/share/logstash/
bin/logstash -e 'input { stdin { } } filter { output { stdout { }}'
After you run the above command, enter some message in the terminal, say for example, you enter "hello world" and logstash will output the "HELLO WORLD" along with timestamp, version and host.
hello world
{
      "@version" => "1",
       "message" => "HELLO WORLD",
    "@timestamp" => 2019-10-29T18:07:59.678Z,
          "host" => "otg"
}
Install Beats (optional)
Once the installation of Elastic stack is complete, you may install one or more Beats which allows you to capture data from different sources. Visit Beats download" page to pick your beat.
Here are the commands to install Filebeat for example.
Download
curl -L -O https://artifacts.elastic.co/downloads/beats/filebeat/filebeat-7.4.1-amd64.deb
Install
sudo dpkg -i filebeat-7.4.1-amd64.deb
Run
To run filebeat as a service:
sudo systemctl enable filebeat.service
sudo systemctl start filebeat.service
Verify
To verify the install, we can configure filebeat to send logs directly to elasticsearch. Edit the config file /etc/filebeat/filebeat.yml and set the following options.
filebeat.inputs:
- type: log
  enabled: true
  paths:
    - /var/log/*.log

setup.dashboards.enabled: true

output.elasticsearch:
  hosts: ["localhost:9200"]
You need to restart filebeat service after changing the configuration.
sudo systemctl restart filebeat.service
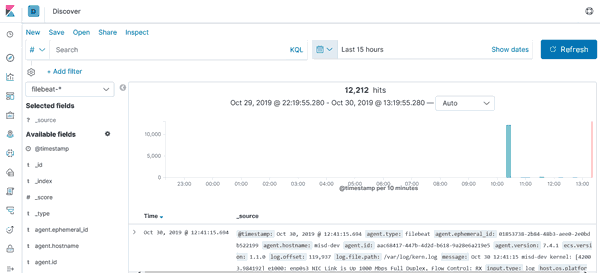
Finally to see the logs, open the Kibana webpage (http://localhost:5601), then go to Discover page and select filebeat-* on the index list.


